Working with Lidar Data using ArcGIS
Module 1: This module focuses on techniques available in ArcGIS to use lidar data to create and visualize 3D surfaces, intensity imagery, and integrate multiple data sources to create a composite Digital Elevation Model (DEM).
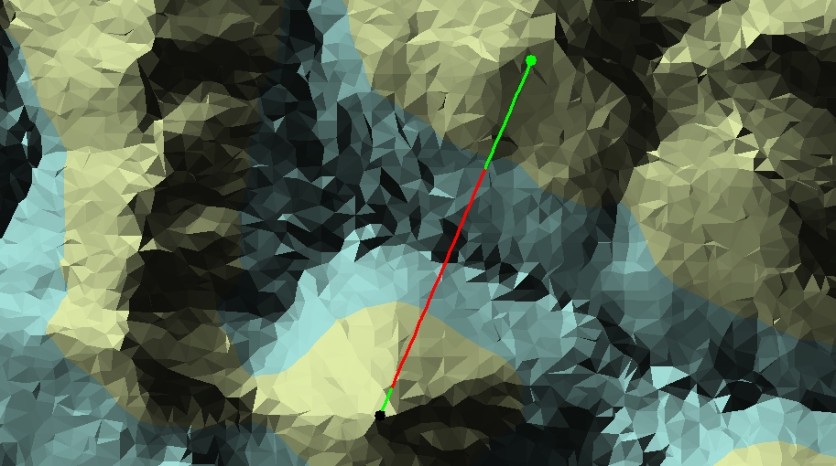
^ In this exercise I created a terrain dataset for the area of interest. I then visualized the terrain dataset in ArcMap and worked with terrain pyramids. Finally, I performed a line of sight analysis on the terrain to determine the placement of the cell phone tower within the chosen geographical area to provide the best signal reception.
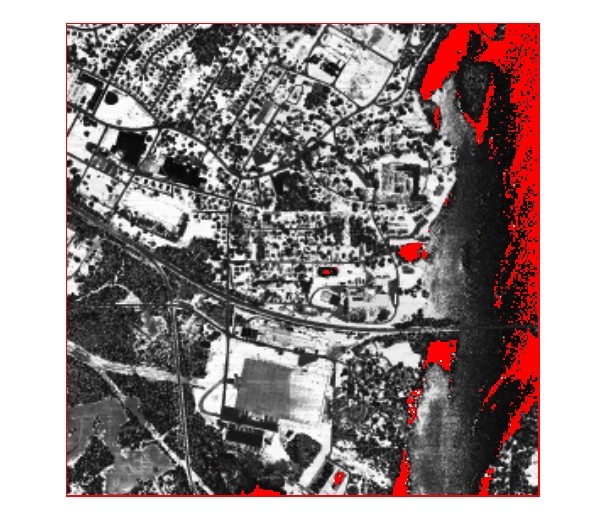
^ In this exercise I used the intensity values from the first return lidar data to produce an intensity image of the study area. I then used this information for detecting features around that area. I generated an intensity imagery of the study area.
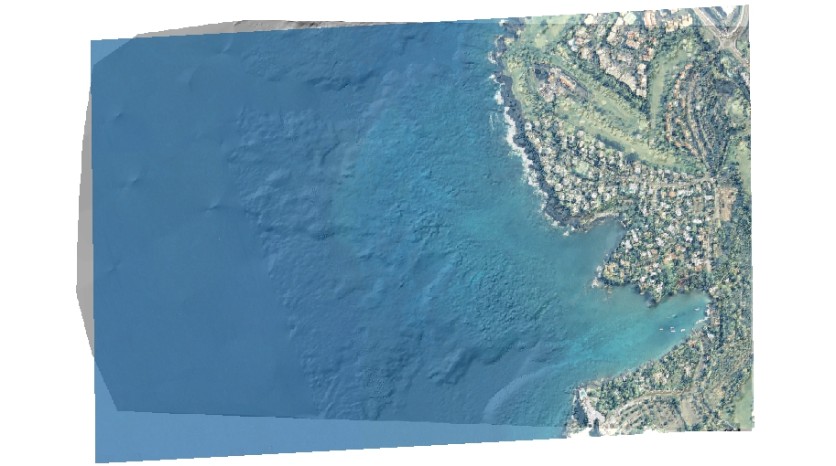
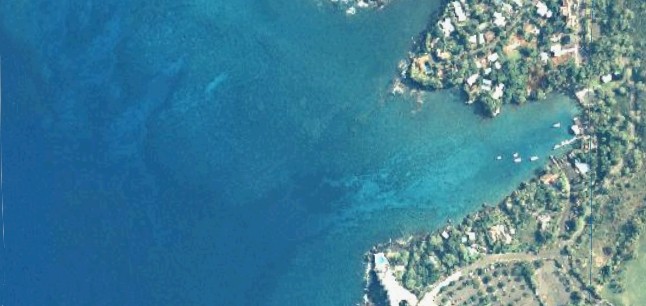
^ In this exercise, I used the data from Keauhou Bay on the Big Island of Hawaii. I first had to build a terrain representing the study area. Next, I create a DEM and a hillshade from the terrain. The DEM is made using data from different sources and therefore, can be called a composite DEM. Next, I derived contours from the composite DEM that represent the coastline of the study area. Finally, I visualized the study area using the composite DEM as elevation data in 3D as shown below with ArcGlobe.