INDEPENDENT PROJECT: Internship with West Jordan City, Spring Semester 2011
For the independent project this semester, I decided to put my thoughts towards an internship. I was attending a church activity just before the semester started, and met some new friends. As I was introducing myself to the group, I mentioned to them that I was studying geography and working towards a GIS certificate as well. One of the girls that I met, told me about how her Dad is looking for interns to help out with his job. This sounded like a grand opportunity and great way to network myself into the GIS world. A few days later I decided to give her Dad, Clint Hutchings, a call. He was excited to give me the opportunity to come in for an interview. He mentioned that he also posted a flyer outside of the Geosciences lab at the Salt Lake Community College, University of Utah, and Brigham Young as well. I emailed my resume to the city of West Jordan and went in for the interview a few days later. The interview went very well and smooth. They were very impressed with my knowledge of GIS and geography. It also helped a lot to inquire my e-portfolio with the resume to show what I have learned so far in Geospatial Technology and Remote Sensing. I definitely have to thank Adam Dastrup and the geosciences department for the encouragement of the e-portfolio. It took a couple of weeks for everything to process; they had to do a background check and a drug screen. I learned that I was not the only intern they hired. Clint showed me the schedule with about 7-10 other interns on it. We decided that Mondays and Wednesdays from 1 pm to 4 pm both days would work out. I had to show him my class schedule in order for the times to be applicable. The first project finally started and I was excited to learn more about GIS. Clint had me and another intern (Dustin) meet in his office to talk about the West Jordan Flex builder Map. This was the first time both me and Dustin have ever heard of flex maps. We were introduced to site that the West Jordan Public is actually allowed to visit. The site address is http://gis.wjordan.com/flexviewer/ and is made from ArcGIS viewer for flex. The map allows users to zoom into the West Jordan boundary and is defaulted with major roads, streets, parcels, rivers, lakes, tracks, hospitals, airports, and parks. The map also allows users to turn on multiple layers such as voting precincts, elementary school boundaries, middle school boundaries, high school boundaries, garbage day collection, and parcel information. There are also 3 different options to view the map; either street view, aerial view or topography view. On the top part of the map, included links to bookmark your results, find an address, West Jordan police stations, a search tool, a draw and measure tool, traffic cameras, and a printing option. This is an awesome map and it’s not too complicated for anyone to use. Clint gave us a packet that goes into detail on how to function the flex viewer. There was one problem with the map and he wanted an intern to solve it. For some reason the Police Station layer was not working properly and did not show up on the map. In the packet it included steps in creating an application/service to use with flex viewer. In order to work on the map, we had to access the arc GIS server manager. I was able to look around and get familiar with this server, but I was not told to work on getting the problem fixed. The first project that I helped out with was making some edits with the storm drainage maps with ArcMap10. I was given a set of instructions on how to generate grid cell maps for the emergency management plan in ArcMap. The first was getting into the database and opening mxd files that showed sections of storm drainage from F1 on up to F17. I had to open the attribute table and look under ‘row’ to zoom to the selected F feature to work on. The next step was to make some changes on the template and edit the title to the correct grid. Then unselect the features, update the balloon callouts, change the township and range, update the legend, put a box outline on it, and then ‘save as’ and rename the grid.
Below is a screen print picture of one of the grids that I edited.
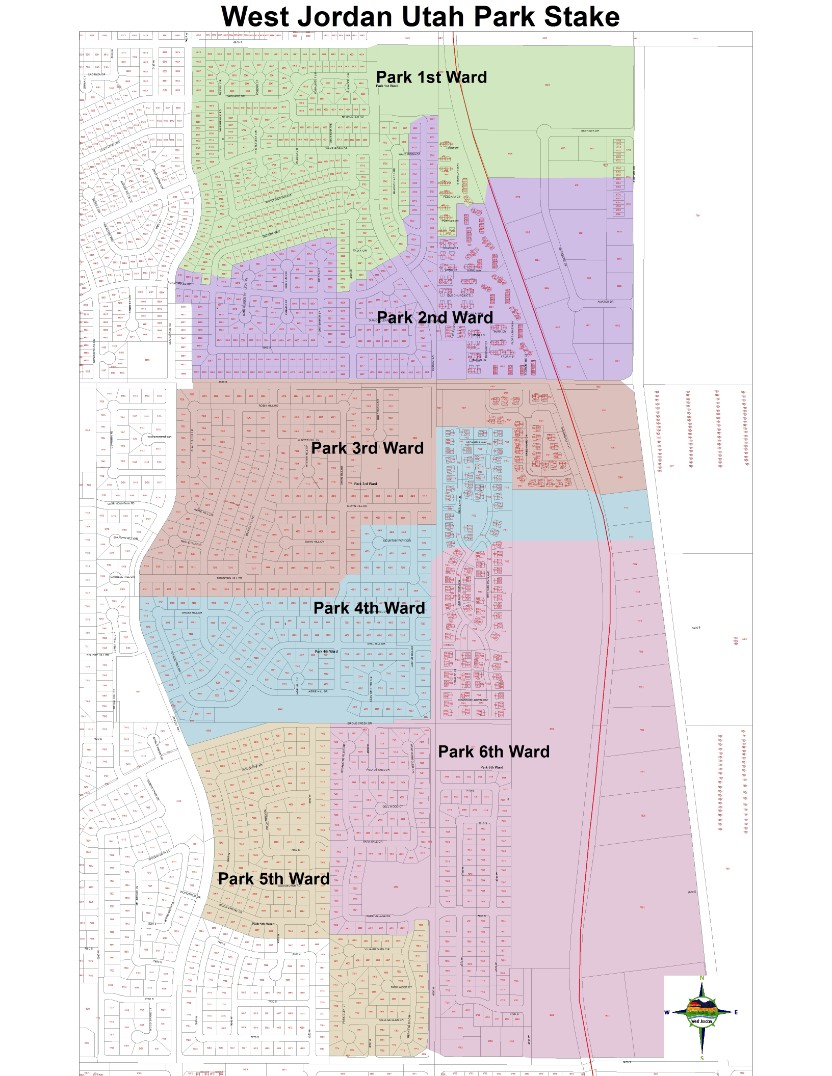
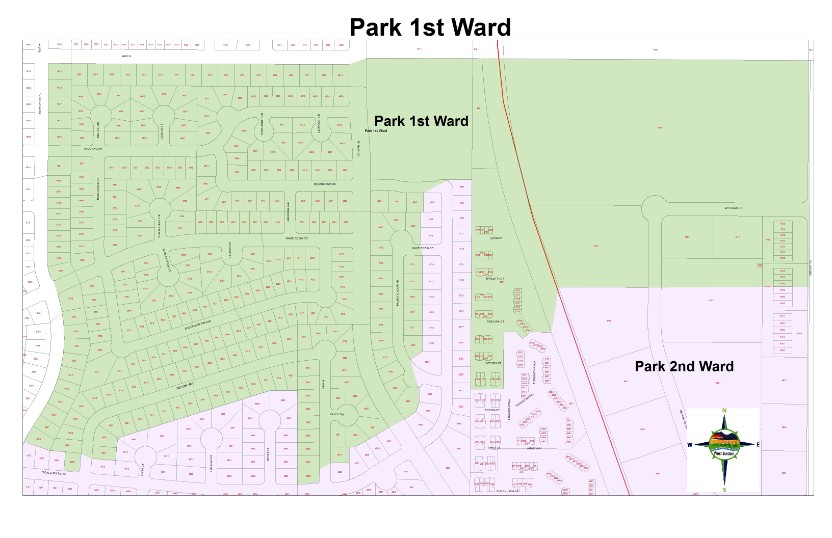
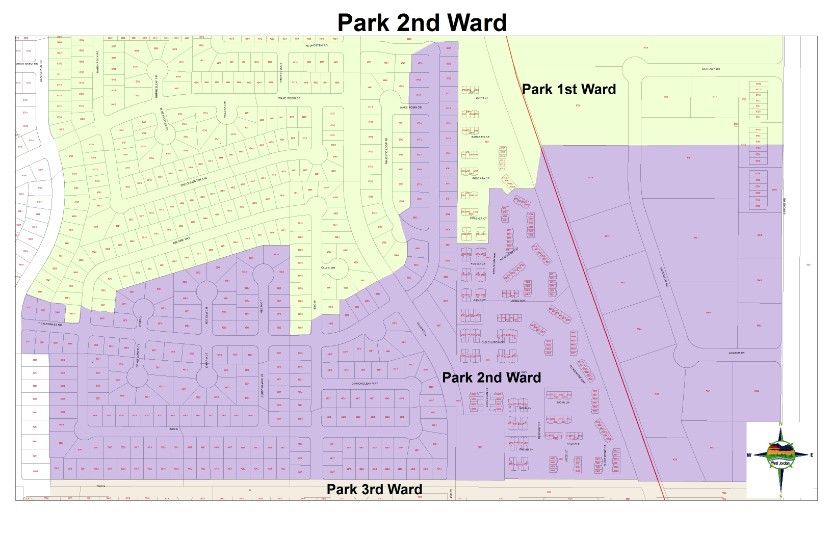
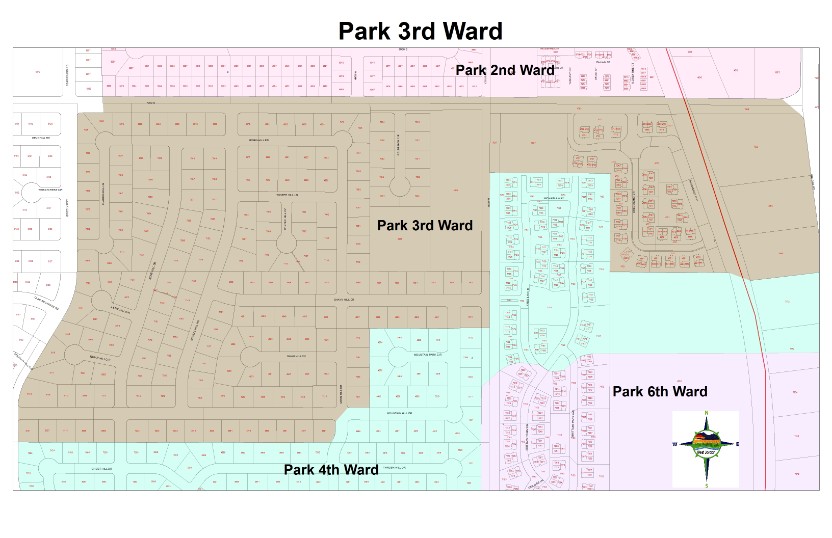
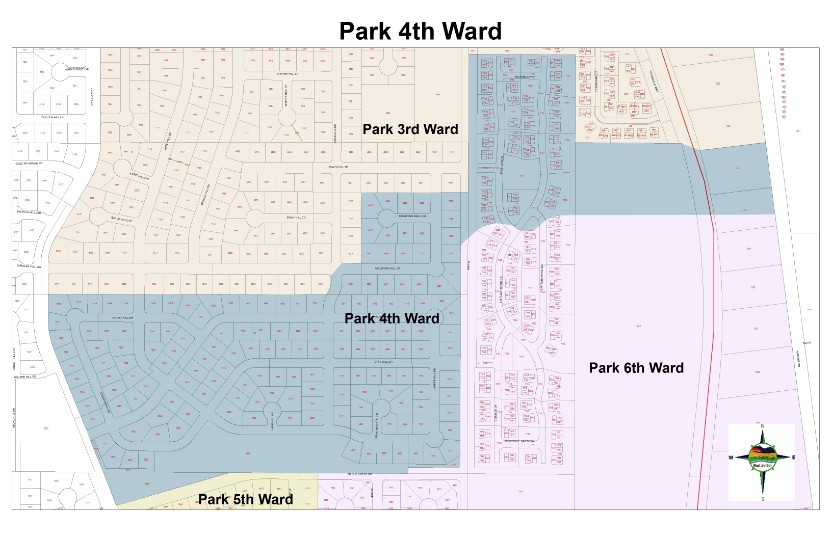
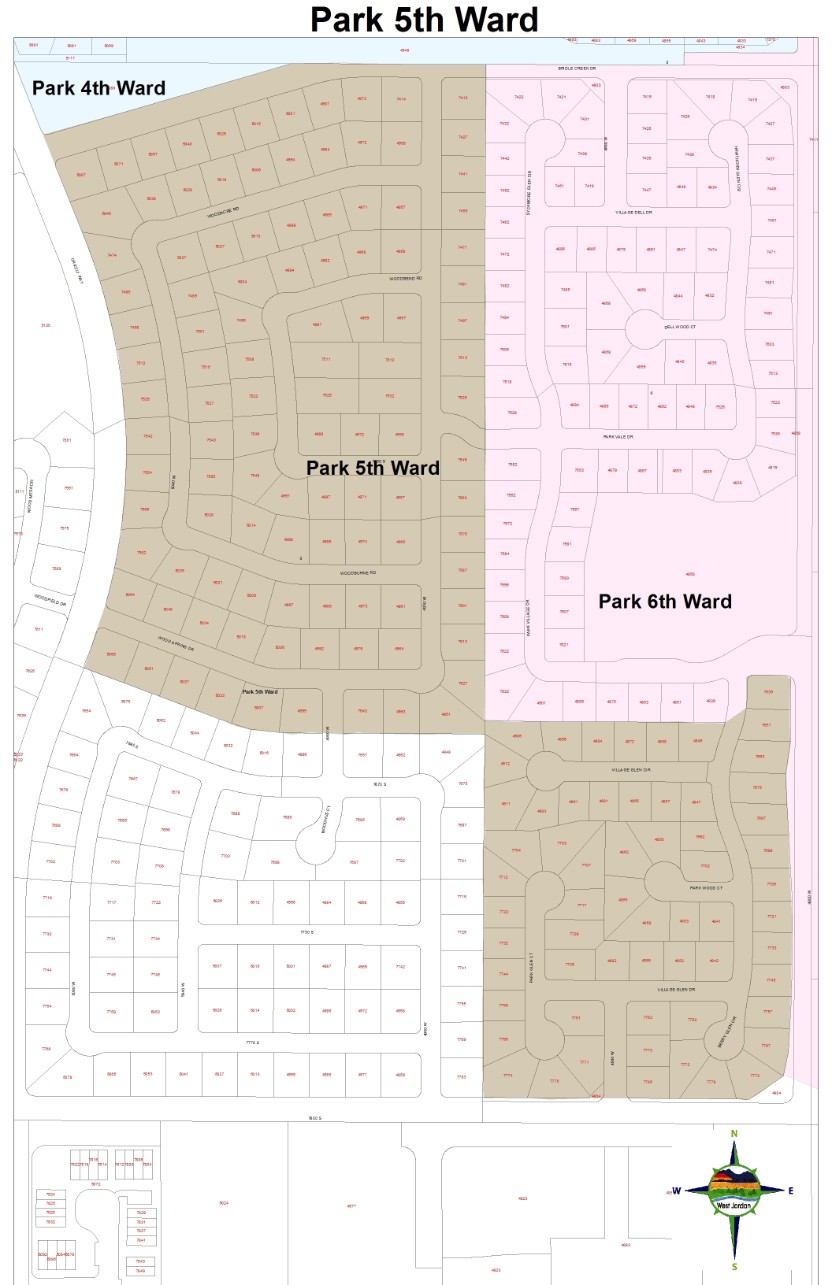
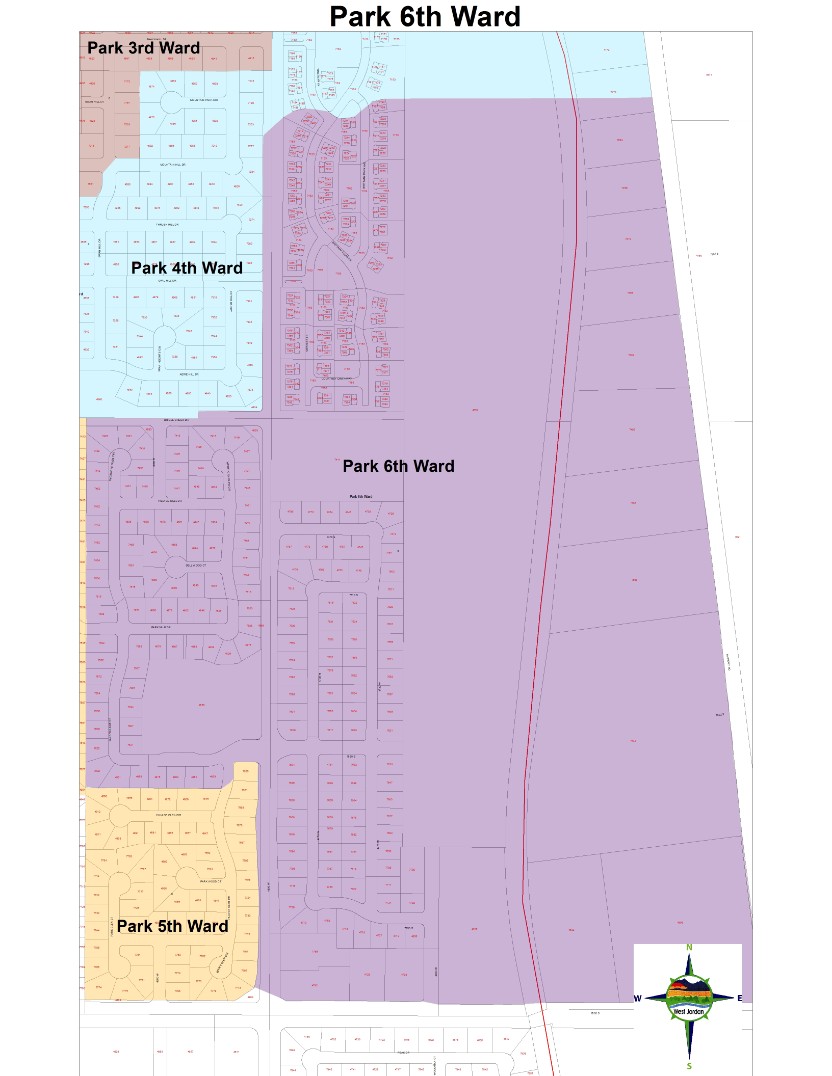
The next project was even more exciting. I was given permission to create a map for a West Jordan Church Stake and emergency management. The stake is called West Jordan Park Stake and it includes 6 total wards that are side by side to each other geographically. The first step was to create a new folder in the West Jordan city data base and open up Arc Catalog. In the catalog I created a new geo database and a shape file for the stake. The shape file is for polygons and the fields in the attribute are for each ward, bishop, unit number, and church meeting time. I then added the streets layer from the West Jordan city database, the parcels data, railroad tracks, and a few other map elements. I was given a hard copy of the ward boundaries and had to zoom in to find the area on the map. Once I found the area, I was able to start editing. I started from the North side of the stake and ended on the South side. Park 1st ward was the first polygon that I created and it was very important to snap together the lines along the parcels for the best topography. I finally had all six ward boundaries edited and with polygons. The next step was to symbolize everything appropriately. I had to make each ward a different color, label the housing numbers, label the streets, and label each ward. I then went into layout view to get my first map ready to print. I was told that they only needed a title and a north arrow. I then had to change the print size to an ANSI E for the entire stake print out. And then for each ward I printed it out as ANSI D. It took a couple of prints and changes of symbology to get everything perfected and readable. I’d say it probably took about 12-16 hours for the project to get done.
Below is a picture of the West Jordan Park Stake, and each ward.
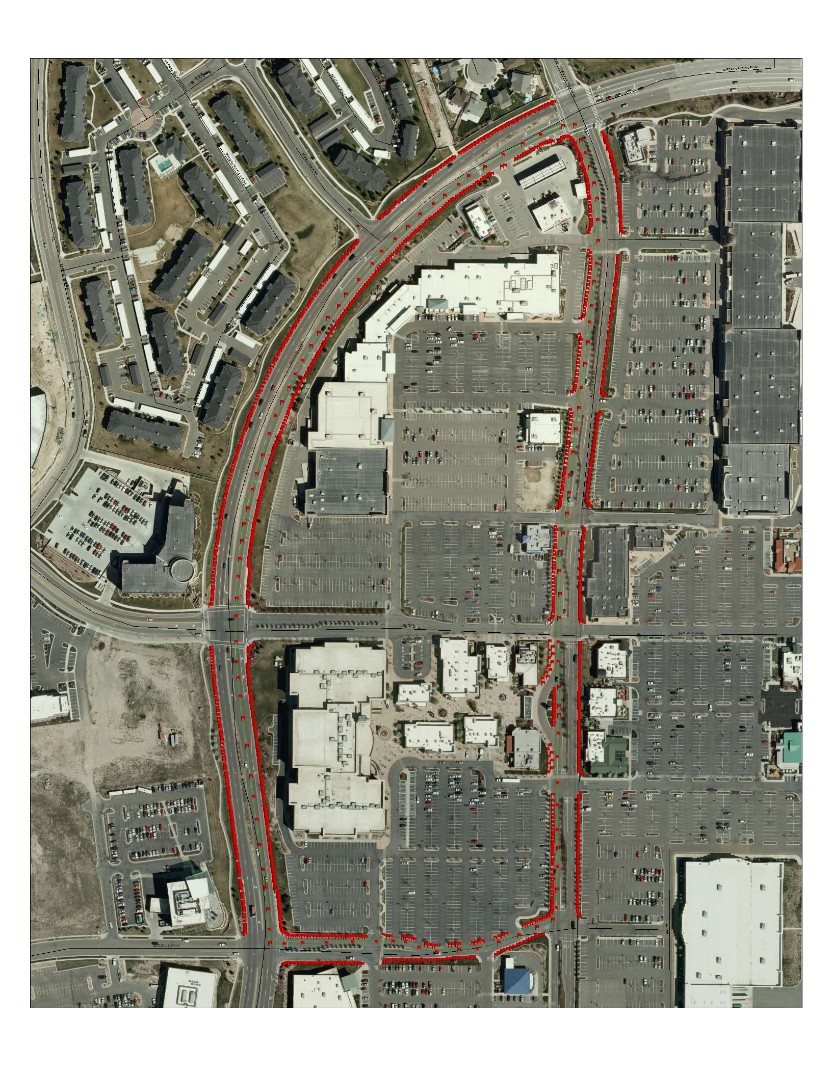
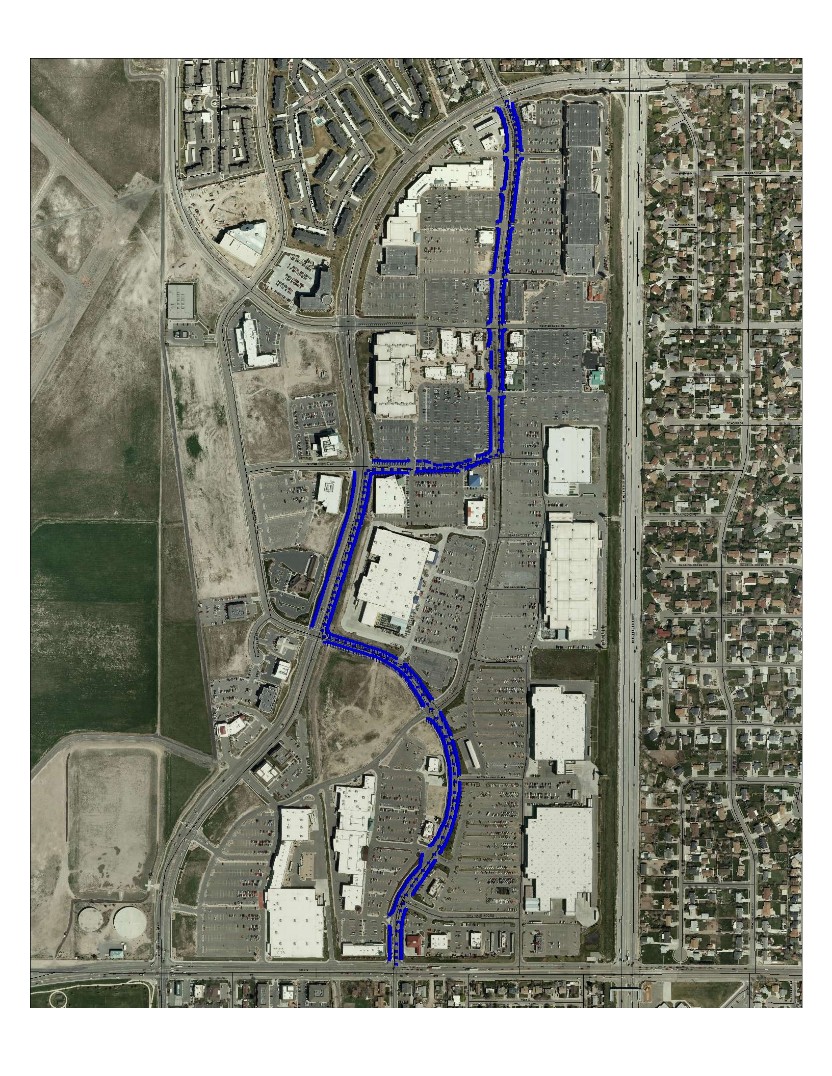
       The next project I did at the City Hall of West Jordan was to work with a scanning machine. I took part in helping out other interns with taking large bundles of mapping projects and turning them into PDF files. The main mapping projects that I scanned were for a proposed highway on the west side of town. It was important for me to keep the bundles together page by page and not to lose anything. I then took 25-30 pages at a time and placed them into the scanning machine. The scanning machine would promptly run these hard copies of maps and turn them into PDF files that were directly emailed to me. I was amazed at how fast and accurate this machine was. I then saved the PDF files in a UDOT folder. The next project I helped out with was for a West Jordan 5K run for charity. I had a meeting with Clint and woman who was in charge of the project. She had a rough draft hard copy of a map that showed the area of Jordan Landing. She showed me two possible routes for the 5k, and said that they plan on placing 1300 flags along the side of the road. My job was to figure out how far apart the flags needed to be. At first this seemed like a huge headache for me to deal with, because that is a lot of flags. But I didn’t stress too much about it. On my first day as an intern, Clint gave me ESRI’s customer support number. Since the city is a customer of ESRI, we are allowed to get technical support. Well, I decided to give them a call since the ArcMap we were using was Viewer only and had limited extensions. The support was helpful, and the people that work for ESRI really cared about solving the problem. At first I had the map all put together by connecting to the utah.gov’s image server for aerial, along with the West Jordan city roads layer added onto the map. I then edited two shape files with the two possible routes as line features. After a couple of phone conversations and emails, ESRI was able to convert the shape files into vertices. This helped out somewhat, but it was not the amount of vertices that I needed. I calculated that I needed to have 650 flags on each side of the road throughout each route. The first route came to placing a flag at about every 8.6 feet. The second route came to placing the flag at every 9.6 feet. I then zoomed into the aerial and started placing flags in areas that were applicable. Grass, dirt, and small rocks were the only places where I could place a flag because of they needed to pound a rebar into the ground. Using the measuring tool became a valuable function in this project. It took quite a long time, but they were very happy with the results.
Below is a picture of route 1, and then route 2.
  Finally, I am working on the last project for the internship. Clint wants me to create a map atlas of Salt Lake County. I was given permission to go to the AGRC or the Utah GIS Portal and start downloading some GIS data of Salt Lake County. Some of the data and resources downloaded are; major streets/shields, roads, rivers, lakes, city locations, municipality borders, salt lake county border, and a few other map elements. I also connected this map with utah.gov’s image server for a detailed view of Salt Lake County. Right now I am working with the symbology to get things transparent with aerial photo. The layout has a title, legend, north arrow, map reference guide, scale, and will be printed out very largely (50, 72) inches.
Below is a picture of the layout and data view of Salt Lake County. 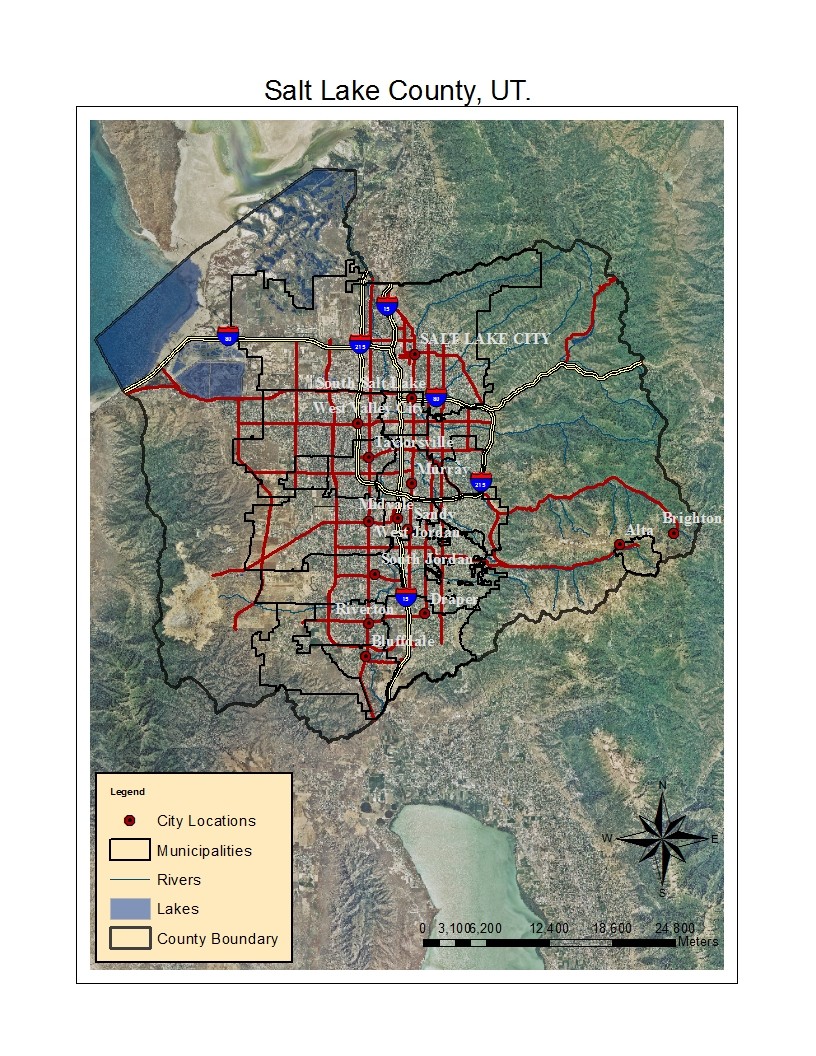 |
||||||


Make a Free Website with Yola.