Applied GIS I Textbook - Mastering ArcGIS 4th editon by Maribeth Price. Chapter 1: GIS Data
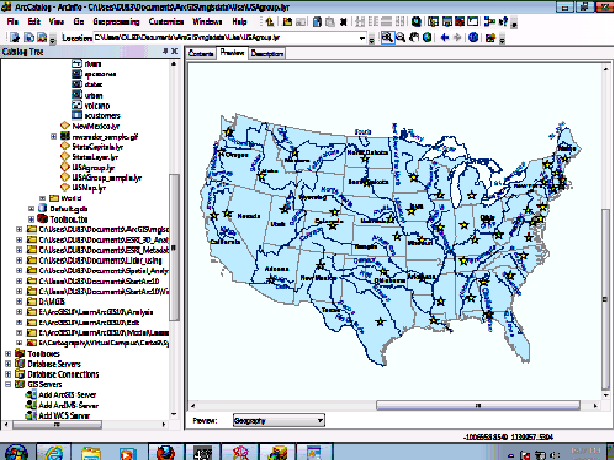 ^ In the first part of the chapter 1 tutorial, I was able to get familiar with ArcCatalog and its functions. I learned how to access geo-databases and look at the contents that it provides. I was also able to create a group layer that has states, cities, rivers, and capitals.
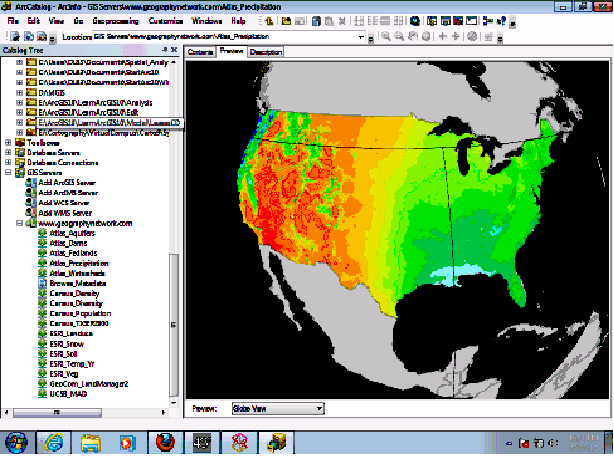 ^ For the last part of the Chapter 1 tutorial, I learned how to access the geography network server. This allows me to find beneficial mapping data and material such as census information and atlas uses.
Chapter 2: Mapping GIS Data
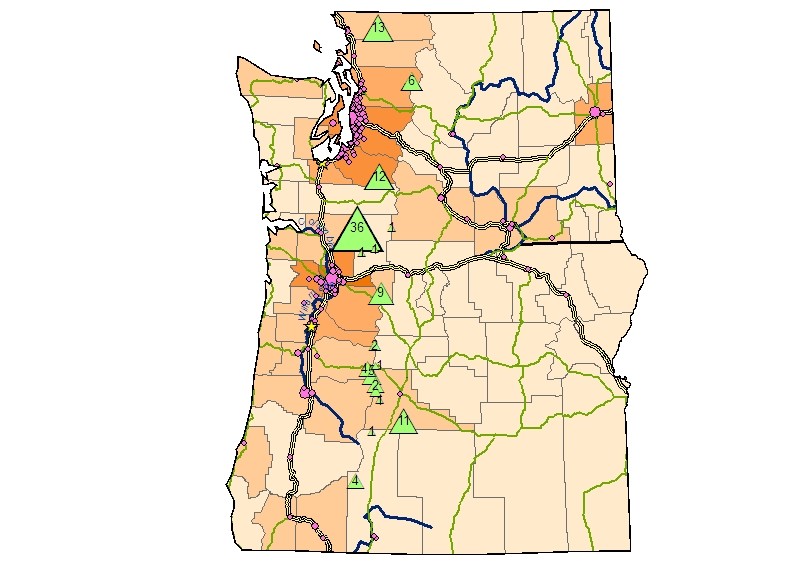 ^ In the first part of the chapter 2 tutoriol, I was able to create a volcanic hazards map in the Washington and Oregon area. Based on the attributes of the data, I classified highways, counties, cities and volcanoes in regards to the clipped area. The volcanoes are represented as to how active they are.
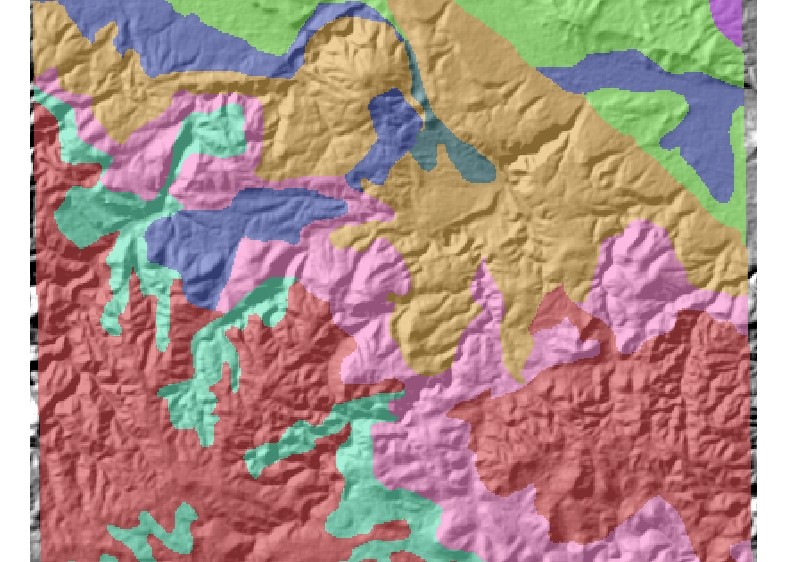 ^ This is a geologic raster that represents categorial data that is classified. It is also transparent and displaying over a hillshade raster.
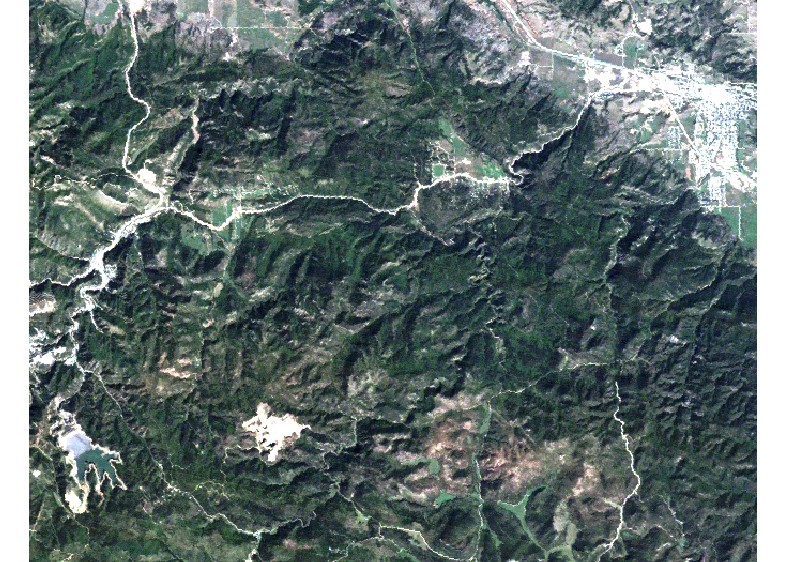 ^ This is a Landsat raster that represents a RGB composite. 3 bands are displayed here, Band 1 (Blue), Band 2 (Green), and Band 3 (Red).
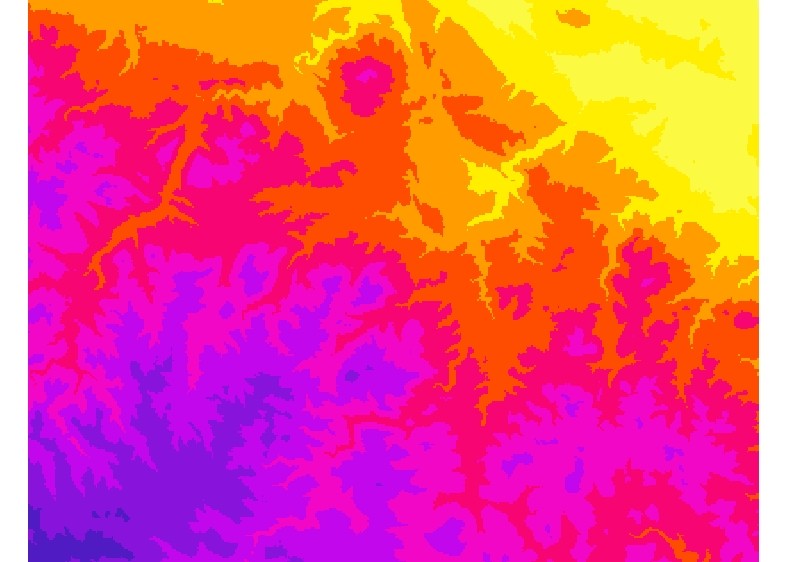 ^ This is a DEM (digital elevation model) that I modified to a 100 meter classification (defined interval scheme). The colors change every 100 meters and is similar to a 100 meter contour interval.
Chapter 3: Presenting GIS Data: Learned basic elements of creating good maps · Learned to choose appropriate coordinate systems for mapping · Learned to label features with annotation · Created map layouts and printed maps 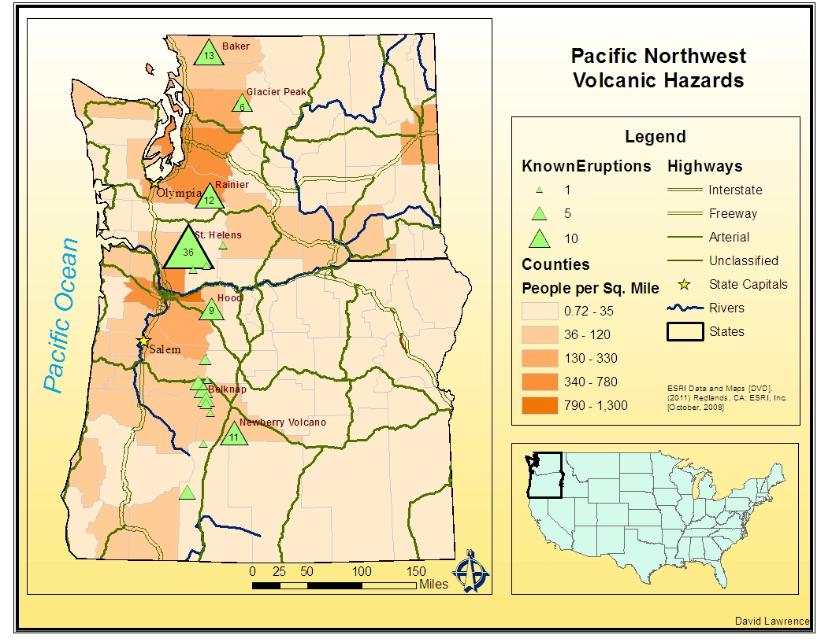 ^ I created an attractive map layout displaying the volcanic hazards. By setting the map projection to a certain central meridian, I was able to match both maps on the layout to show be straight north and eliminating some distortion. I labeled some features interactively and then worked with annotation in order to make some needed adjustments to volcanic labels. The legend, neatline, scale, north arrow and title was then applied to the layout along with some other map elements.
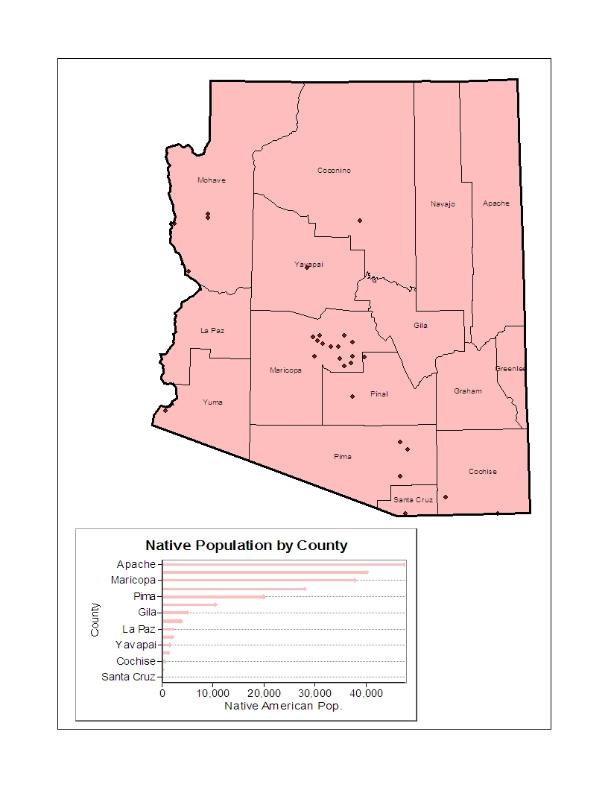 ^ This is a simple graph that I created by using the graph wizard on ArcMap.
Chapter 4: Attribute Data
|
||
Make a Free Website with Yola.